Eevee
An all-in-one EV charging app: compatible stations, availability, costs, trip planning and reports.
Read reference →
Winning mechanism
Turns data only experts can read (mission, satellite, lab) into something a non-expert can explore, feel or act on.
An all-in-one EV charging app: compatible stations, availability, costs, trip planning and reports.
Predicts blue-whale habitat day by day and shows where shipping routes cross it, to cut ship strikes.
A map of plants from a global biodiversity database with an AI gardening guide for any spot.
Turns student Reddit discussions and course catalogs into comparable course profiles: difficulty, workload, professors.
Turns any public GitHub repository's history into a readable timeline of milestones and technologies.
Turns packet captures into plain-English, evidence-backed security narratives.
Turns any waste material into three product ideas with build instructions, 3D previews and impact estimates.
Select any dates on a stock chart and get a plain-English, sourced explanation of what moved the price.
Regenerative-farming insights with financing, pricing and spending analytics for farmers.
Shows a planned data centre's real local costs: electricity bills, water use and emissions.
Simplifies immigration eligibility by reading scattered government pages into one clear assessment.
An agent that finds credible solar, wind, hydro and geothermal sites from free satellite data in minutes.
See how much solar your roof could produce, save and offset, from satellite imagery and irradiance data.
Shows restaurant owners what dishes sell and at what price near a location, from delivery data.
Links prediction-market probabilities to your stock portfolio so you see event risk.
A navigable graph of corporate ownership and supply links to spot hidden systemic risk.
A VS Code extension that maps a codebase's dependencies as a navigable graph with heatmaps, search and ticket context.
Explains undocumented legacy code at several levels so the 'why' survives after its authors leave.
A walking GPS that routes by safety, using live crime data and street lighting, and reroutes when danger appears.
Helps coast guards spot likely illegal fishing vessels across vast patrol zones.
Uses New York open data on ridership and incidents to help riders choose safer, less crowded subway trips.
Estimates a prompt's energy, CO2 and water footprint and rewrites it to use fewer tokens.
Pick a place and a year on a 3D globe, and step into a generated 3D world of that moment with a voice guide.
An agent-driven dashboard that turns years of Kingston resident complaints into insight for citizens and the city.
A 3D planning tool that places proposed buildings on a real Kingston map and shows their traffic, emissions and noise impacts.
Two weeks of daily planting windows per 100 m of field: is there enough moisture to germinate, and is the ground safe for machinery?
 ▶ Video
Walk a 3D virtual museum where each painting opens a live NASA data visualization of how Earth's systems connect.
A three-level city-building game that teaches sustainability, ending with urban-planning decisions made on real NASA Earth data.
 ▶ Video
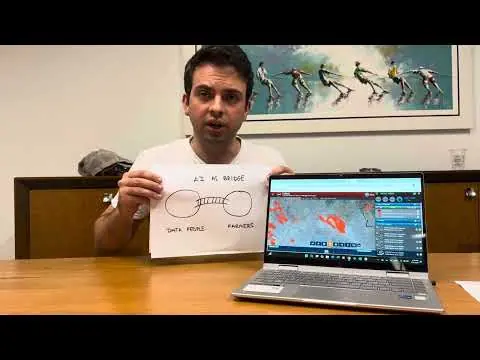
Ask a voice agent about wildfires near you in plain language; it queries NASA FIRMS and weather data and moves the map for you.
 ▶ Video
Pin a spot, get told before Landsat flies over, then compare your ground measurement with the 3×3 pixel it captured.
 ▶ Video
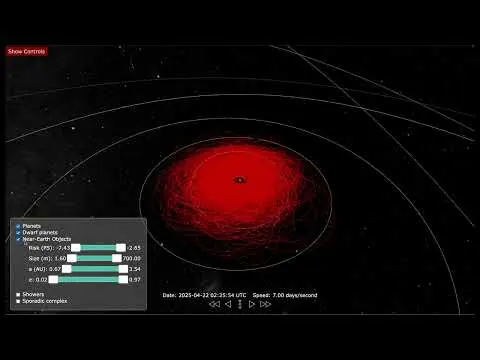
A physically based 3D orrery that puts near-Earth objects and meteoroid streams in one view to show the overlooked hazard to satellites.
Mother Earth meets her children North, South and Neutral every five years to compare climate notes — then you play, and see the forecast if nothing changes.
 ▶ Video
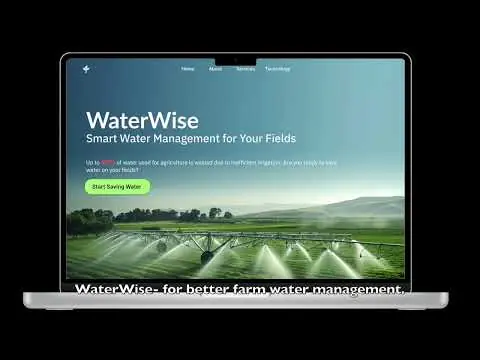
Map your field, enter the crop and irrigation system, and get a 7-day watering schedule computed from NASA-backed evapotranspiration data.
 ▶ Video
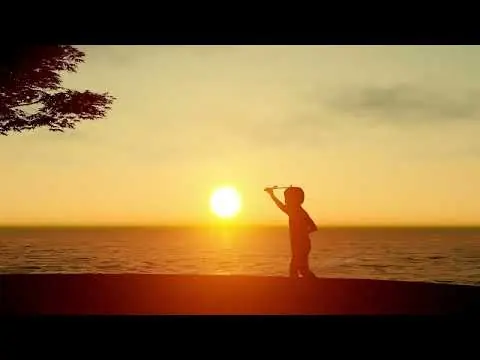
A digital children's story narrated by the Sun that explains how space weather touches daily life, with science sourced from NASA and NOAA.
Ultra-local, personalized weather risk from NASA Earth observation data, with the safest time window for your activity.
Interactive dashboard showing how radiation and microgravity together affect astronaut health at the molecular level.
A story-driven farming game: travel with Henry to farmers facing floods, heat, drought and salty soil, and solve each with real NASA satellite data.
crafterwiki similar --mechanism expert-data-for-everyone --json